I’ve recently deployed the Elastic Stack and set up sending logs to it. To automate certain checks, I then wanted to set up some alerts based on the logs. However, I found that there is several ways that this can be set up in Kibana. Each way has its shortcomings and pre-requisites, which aren’t particularly well documented in Elastic’s documentation. I’ll explain my findings in this post.
Types of Kibana Alerts
Rules
These used to be called Kibana Alerts (for some reason Elastic has done a lot of renaming over the years), and in most cases I found these to be the best choice. These can be found by navigating to Stack Management > Rules and Connectors in Kibana.
Rules are particularly good as they provide a UI for creating alerts and allow conditions to be strung together using logical operators. However, there is no support for advanced operations such as aggregations (calculating the minimum, maximum, sum, or average of fields). Only the count of logs or a ratio can be alerted on.
As a pre-requisite, the Kibana Logs app has to be configured. This is can be done by navigating to Logs under the Observability menu in Kibana. The logs need a timestamp field and a message field.
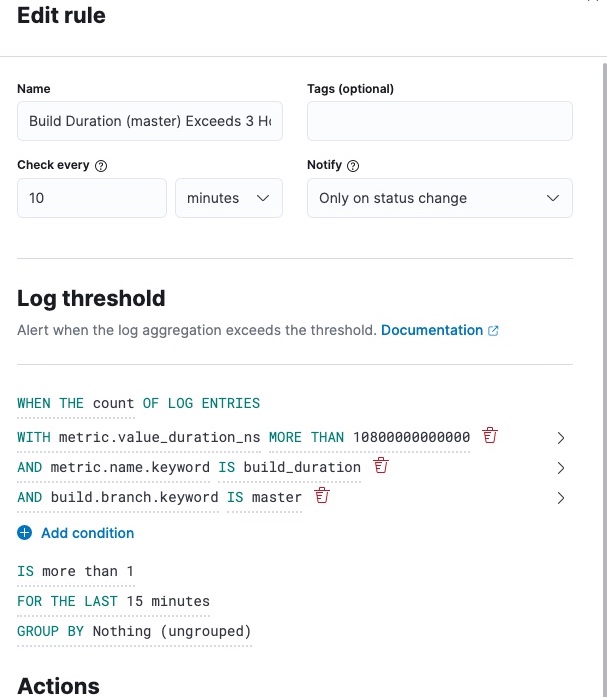
Watcher Alerts
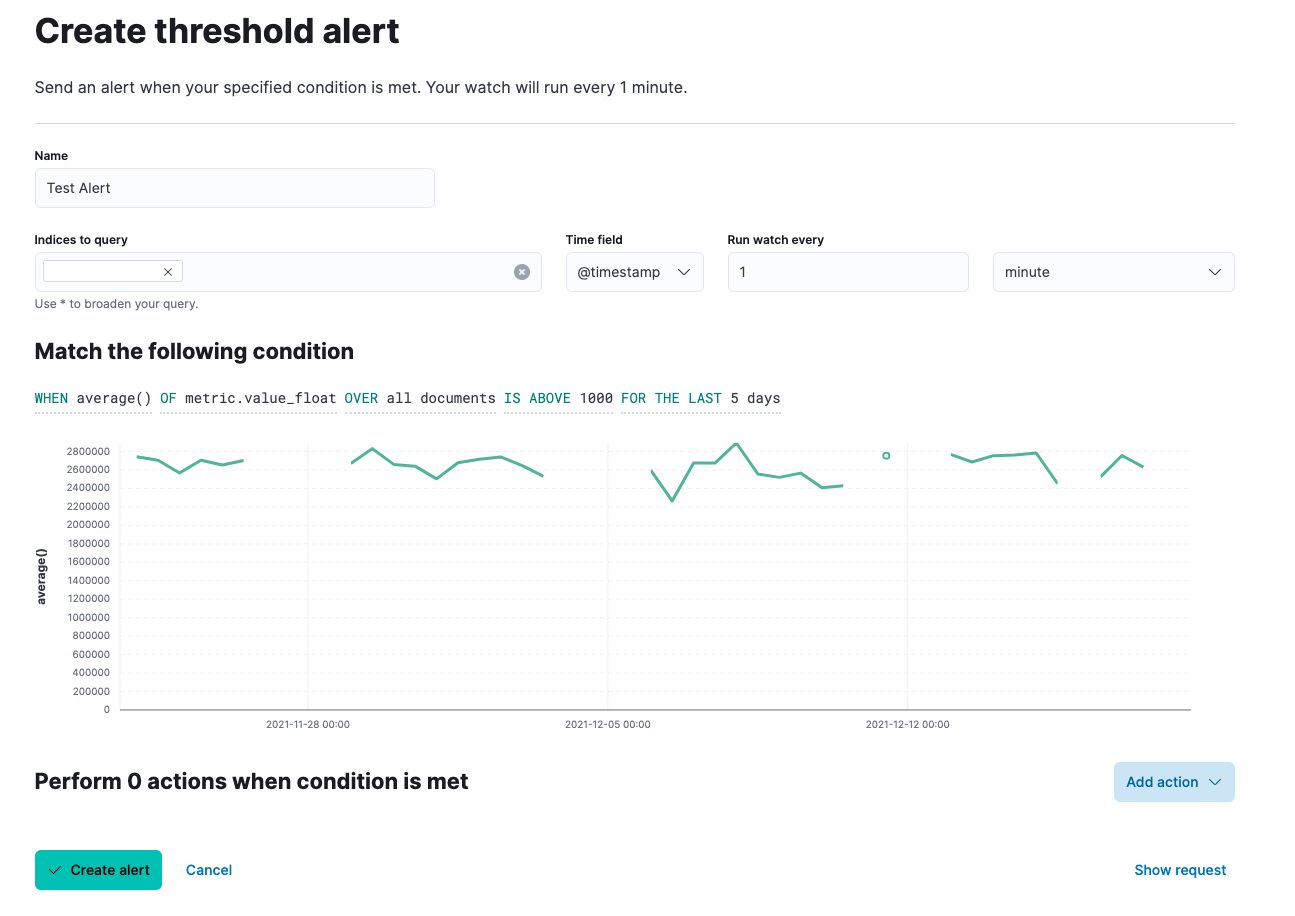
Watcher alerts are significantly less powerful than Rules, but they have their benefits. They can be set up by navigating to Stack Management > Watcher and creating a new “threshold alert”.
A UI similar to that of Kibana Rules is provided. Aggregations can be performed, but queries can’t be strung together using logical operators. This massively limits the usability of these alerts, but they could be a good choice if you want to perform aggregations on a single log field.
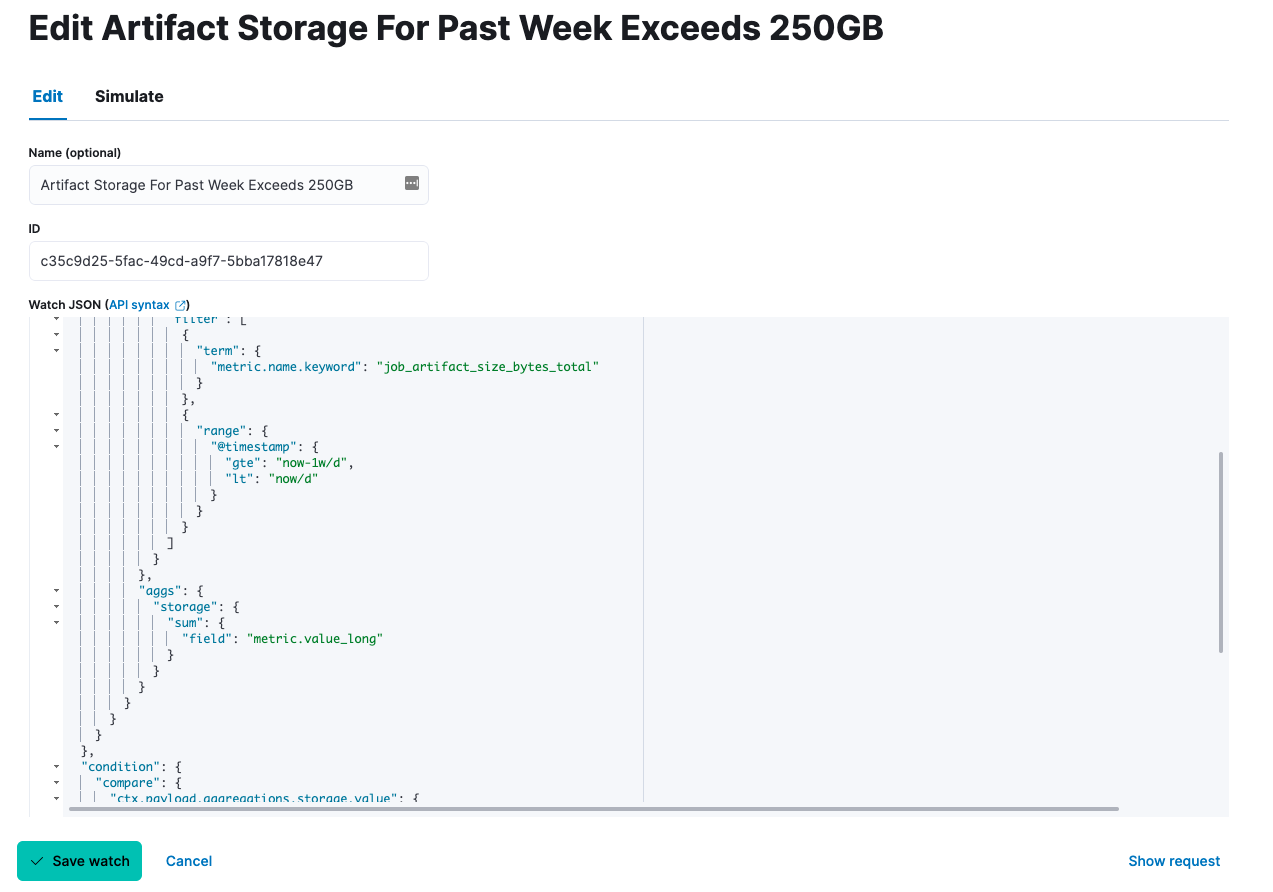
Advanced Watcher Alerts
Advanced Watcher alerts are the most powerful alerts that can be set up in Kibana. They can be set up by navigating to Stack Management > Watcher and creating a new “advanced watch”.
These alerts are written using Watcher JSON which makes them particularly laborious to develop. Anything that can be queried on using the Elasticsearch Query API can be created into an alert, however, allowing for arbitrarily complex alerts.
Advanced Watcher Alert Development
To iterate on creating an Advanced Watcher alert, I’d recommend first crafting the search query. It can then easily be created into an alert. To do so, you can use the following curl template:
curl -X GET "<Kibana URL>/<your index>/_search?pretty" --user <Elasticsearch username>:<Elasticsearch password> -H 'Content-Type: application/json' -d'
{
  "size": 0,
  "query": {
    "term": {
      "sourceId": "100"
    }
  }
}
'
Once you’ve got the right values returned from the API, insert your query under the "body" key of the search request template provided when you create a new Advanced Watcher alert.
To get the appropriate values from your result in your alert conditions and actions, you need to use the Watcher context. The documentation doesn’t include all the fields, unfortunately. To see what you’re working with, you can create a “logging” action. To check all the context fields, you can create a “logging” action and set it up to log the entire Watcher context by logging {{ctx}}. Then, navigate to the “Simulate” tab and simulate the logging action to inspect the entire context object.
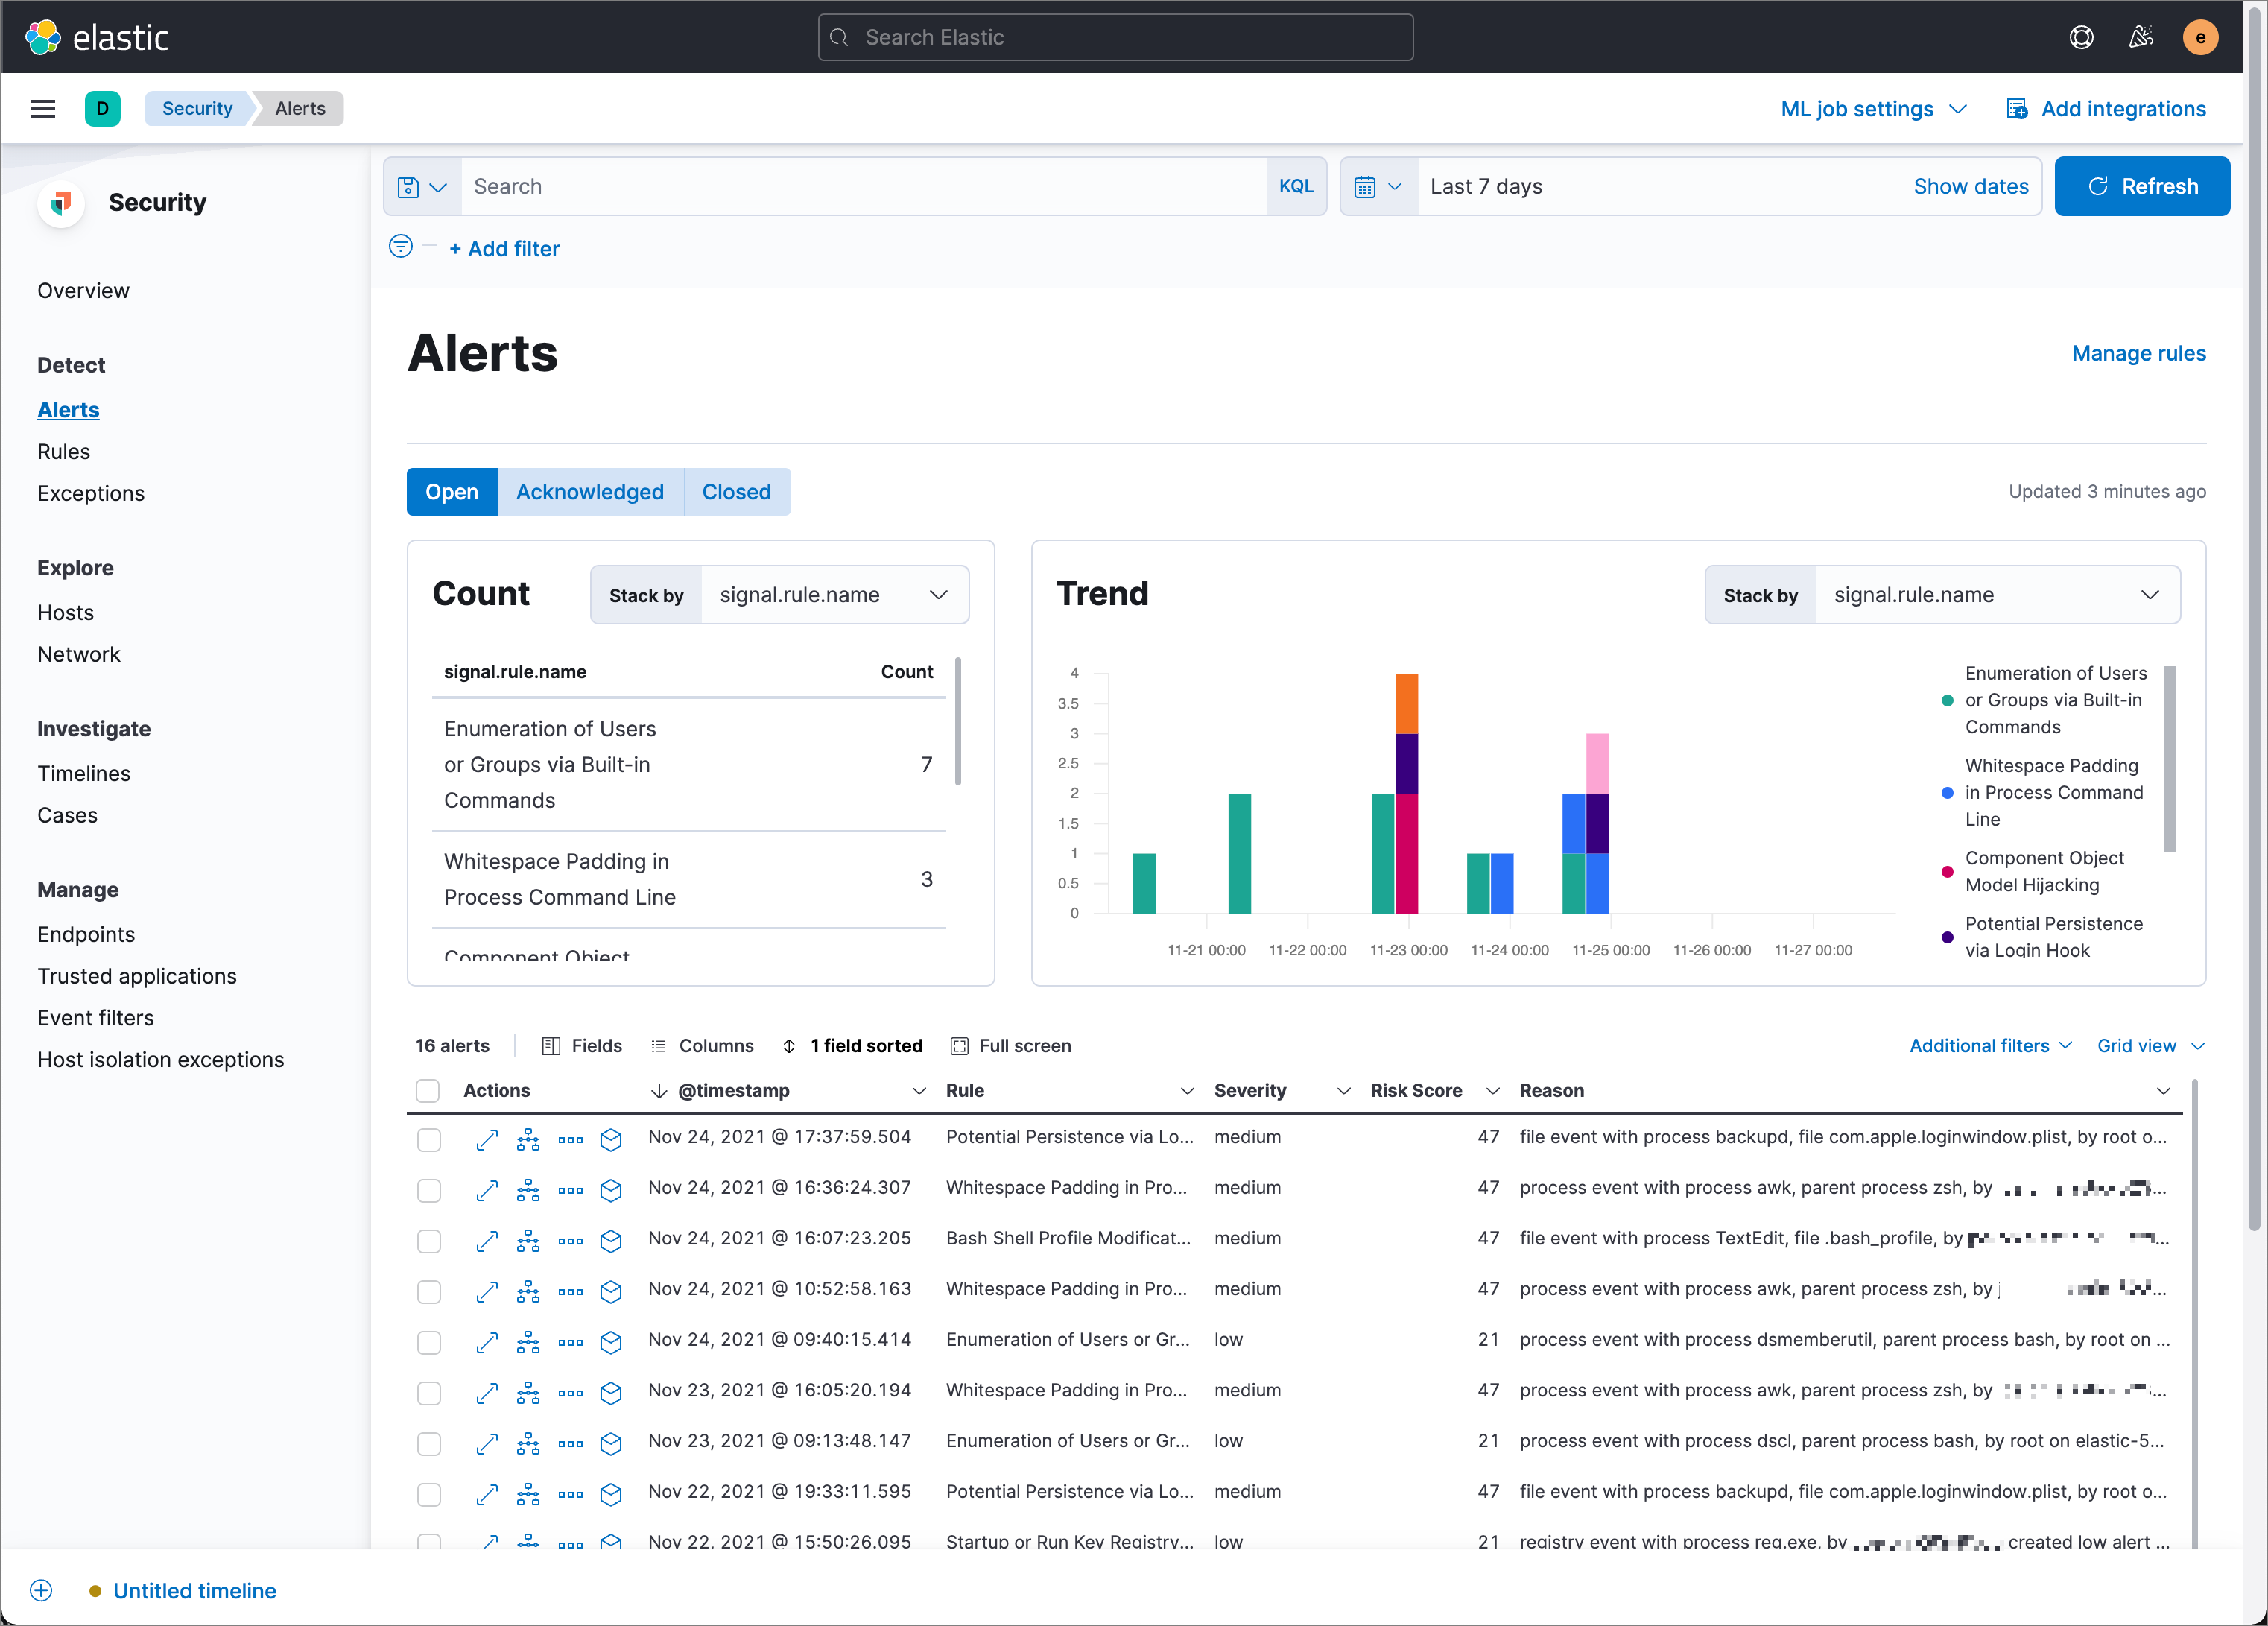
Elastic Security Alerts
The final type of alert is admittedly one I’ve not had the opportunity to use much. These can be found in Alerts under the Security menu in Kibana. The UI provided is similar to that of the Rules so it shared the same pros and cons. However, these alerts are restricted for use by Elastic integrations, Elastic Beats, and monitoring systems. There is a complete list of prebuilt alerts in the Elasticsearch documentation.